

What History Says About Investing After Midterm Elections
Written by Chris DeVito
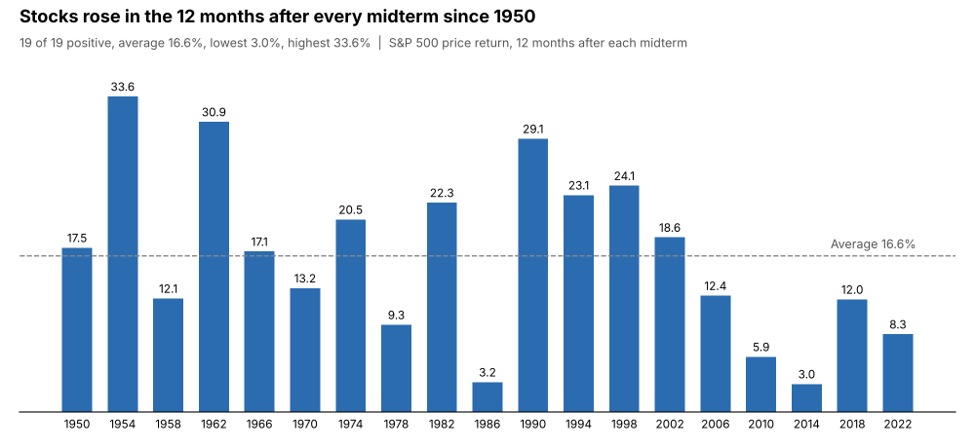
Since 1950, the S&P 500 has been higher 12 months after every single midterm election, 19 for 19, with an average gain of roughly 15% to 17%.
The 2026 midterms are behind us, and the past few days have brought the kind of market swings that make even disciplined investors second-guess themselves. Headlines will spend weeks debating what a shifted Congress means for taxes, spending and regulation.
If you are a high earner sitting on cash, a year-end distribution or a bonus you haven't deployed yet, it is worth stepping back from the noise. History tells a fairly consistent story about what tends to happen next, and it is a story long-term investors should know.
The Data: What Happened 12 months Later
Across the 19 midterms since 1950, the S&P 500 finished higher 12 months later every time. Even the weakest year gained about 3%, and the strongest gained more than 33%.
Research firms measure from slightly different start dates, but they land in the same range:
| Source | Period Studied | Average 12-month return after midterms |
|---|---|---|
| Capital Group | Since 1950 | 15.4% |
| Pepperstone | 1950–2022 | 15.1% (median 14.5%) |
| Oxford Economics | Since 1950 | About 15% |
| U.S. Bank | 31 midterms over 125 years | 12.4% |
The contrast with the run-up is striking. In the 12 months before a midterm, the S&P 500 has averaged only about 0.3% since 1950. Looking further out, stocks have returned an average of roughly 33.7% in the 24 months after a midterm.
Why Markets Tend to Rise After Midterms
There is no single cause, but three forces show up again and again.
- Uncertainty gets resolved. Markets dislike not knowing. Before the vote, investors can only guess at the balance of power. Once results are in, businesses that delayed hiring, capital spending or deals tend to move forward.
- Gridlock limits surprises. The president's party usually loses ground in midterms. A divided government makes sweeping changes to tax law or regulation less likely, and markets tend to welcome that predictability.
- The presidential cycle. The 12 months after a midterm run into the third year of a presidential term. That year has historically been the strongest of the four-year cycle, as administrations tend to favor growth ahead of the next presidential race.
Notice that none of these depend on which party wins. The historical pattern has held under Republican and Democratic presidents and under every combination of control in Congress.
What the Data Does Not Say
A perfect track record is compelling, but sophisticated investors should read it with care.
- The sample is small. Nineteen observations is not a law of nature. Interest rates, earnings and recessions shaped every one of those years.
- The streak has broken before. Going back further, the 12 months after the 1938 midterm ended lower. A long streak is not a guarantee.
- Gains often meant getting back to even. Midterms in 1974, 2002 and 2022 fell during bear markets. Investors who were already fully invested used much of the post-election rally to recover losses, not to build new wealth.
- Not every year was strong. Some post-midterm years returned only low single digits, well below the average.
The takeaway is not “buy because of the calendar.” It is that political noise has historically been a poor reason to sit on the sidelines.
What this Means for High-Income Professionals
For business owners, partners and executives, the post-election window often lines up with year-end decisions. That timing creates real opportunities beyond simply “buying stocks.”
- Put idle cash to work with a plan. If you have been holding cash until after the election, consider a defined schedule for deploying it rather than trying to pick the perfect day.
- Harvest losses before December 31. Recent volatility may have created losses in taxable accounts that can offset gains or up to $3,000 of ordinary income, while keeping your market exposure intact.
- Max out tax-advantaged buckets. Year-end is the time to confirm 401(k), profit-sharing and cash balance plan contributions, which can shelter six figures of income for high earners.
- Rebalance on purpose. A strong run in one asset class can quietly push your portfolio past the level of risk you actually signed up for.
A few questions worth asking yourself: How much cash are you holding right now, and what is it costing you in growth? If the market rose 15% over the next year, how would you feel about having waited? And is your tax plan coordinated with your investment plan, or are they being managed separately?
If any of those questions are hard to answer, that is usually a sign worth a conversation. We help AM Law 100 attorneys connect their tax, cash flow and investment decisions into one plan, so that choices like these are made deliberately rather than reactively.
Sources
- BNY: How do midterm elections impact markets over time? (May 2026)
- Pepperstone: Do stocks rally after midterms?
- Reuters via Yahoo Finance (citing Deutsche Bank and Oxford Economics)
- The Berkshire Edge (citing U.S. Bank and Capital Group)
- Real Investment Advice: Midterm election returns
- Nasdaq: Will the stock market crash in 2026?
Disclosures
Past performance does not guarantee future results. All investing involves risk, including the possible loss of principal. Historical market trends and returns are shown for illustrative and educational purposes only and should not be relied upon as a prediction of future results. References to tax strategies are general in nature and are not intended as tax advice. Investors should consult their tax and legal advisors regarding their individual circumstances.
Registered Representative and Securities offered through Hornor, Townsend & Kent, LLC (HTK). Member FINRA/SIPC. 800-873-7637. Power Forward Group is unaffiliated with Hornor, Townsend & Kent, LLC.
HTK does not provide legal and tax advice. Always consult a qualified tax advisor regarding your personal tax situation and a qualified legal professional for your personal estate planning situation.
9232703JZ_NOV28
