

Investing Near All Time Highs
Written by Chris DeVito
If the last few years of the market have shown us anything, it’s that more and more people (particularly retail investors) are very comfortable with “buying the dip”. The thought process is simple, long term they feel the market will do well, so anytime the market comes down it must only be temporary.
As the year winds down, the S&P 500 and the DOW Jones are both sitting near all-time highs. That and all of this AI talk brings up the same questions I hear from clients constantly. Are we in a bubble? When will it pop? What will cause it?
We haven't had a true bear market in a while…
The last calendar year the market finished down was 2022. Before that, the market has been on a remarkable run since the 2008 crash, close to two decades. Knowing when to stay in and when to step out is one of the hardest parts of investing. But if you have a long-term strategy and a 10-year time horizon, a new high shouldn't change how you invest very much.
Negativity sells when it comes to the news. Whether that’s political, local, or financial news. The story of, “did you hear what so and so said” or “he predicted the last crash…what he’s doing now”….tune it tonight at 10pm…those get clicks and revenue. When it comes to financial news though, they often aren’t analysis, mainly clickbait. So, let’s look at what actually has happened in the markets following new all-time highs.
What happens in the 12 to 24 months after a record high?
When the S&P 500 makes a new high, does it turn around and drop right away? Does it dip and then recover? Here is what the data shows:
- Since 1970, J.P. Morgan found that investing at an all-time high earned an average of 9.4% over the next 12 months, versus 9% on other days. Over two years, it was 20.2% versus 18.5%.
- Fidelity's research back to 1950 shows an average gain of 12.7% in the year after a record close.
- From 1988 through 2023, the S&P 500 averaged 11.9% over any random 12-month period, but 13.4% in the 12 months following a record close.
Historically, the market doesn't hit a new high and then immediately crash. Records tend to show up when earnings are growing and momentum is strong.
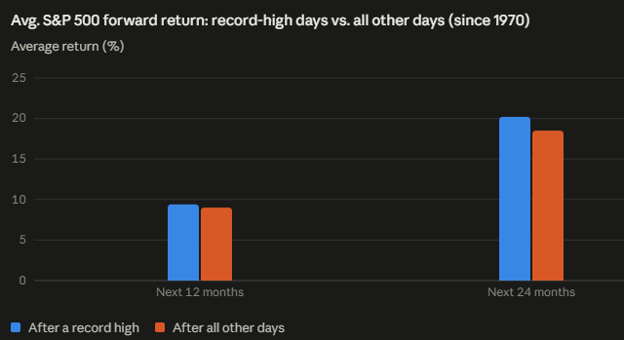 (Past performance is not indicative of future results.)
The real anxiety: buying when the market is already up…
"Buy the dip" is easy to say. Investing after a big run is much harder, and that's where most of the anxiety comes from. But the cost of waiting has been large. If you sat out the last several years, you missed one of the biggest bull markets on record, possibly the biggest.
The tax angle for high earners
If you're a high-income business owner, selling to avoid a drop usually means realizing gains. You then have to be right about when to get back in. Rebalancing, loss harvesting, and phasing in cash are tax-aware ways to manage risk without trying to time the market.
The Final Verdict
Don't ask whether the market is too high. Ask whether your plan holds up if it falls 15–20% and whether you'd stay the course. If you're not sure, or you're sitting on cash waiting for the "right" moment, let's talk.
Disclosures
Past performance does not guarantee future results. All investing involves risk, including the possible loss of principal. Historical market trends and returns are shown for illustrative and educational purposes only and should not be relied upon as a prediction of future results. References to tax strategies are general in nature and are not intended as tax advice. Investors should consult their tax and legal advisors regarding their individual circumstances.
Registered Representative and Securities offered through Hornor, Townsend & Kent, LLC (HTK). Member FINRA/SIPC. 800-873-7637, www.htk.com. Power Forward Group is unaffiliated with Hornor, Townsend & Kent, LLC.
HTK does not provide legal and tax advice. Always consult a qualified tax advisor regarding your personal tax situation and a qualified legal professional for your personal estate planning situation. 9139159DH_SEP28
Sources
https://www.jpmorgan.com/insights/markets-and-economy/top-market-takeaways/tmt-slower-growth-higher-inflation-and-s-and-p-five-hundred-all-time-highs
- Published: August 15, 2025
- Data as of: August 1, 2025 (source line: "Bloomberg Finance L.P., J.P. Morgan. Data as of August 01, 2025")
- Exact figures (avg. S&P 500 forward price return, 1970–present):
- Methodology, verbatim from the source: "'Investing at all-time highs' represents average of rolling forward returns calculated from each new S&P 500 record high for the subsequent 3-months, 6-months, 12-months, and 24-months intervals. 'Investing at not all-time highs' represents the average of rolling forward returns over the same intervals from days in which the S&P 500 was not at a new high."
- Note: These are price returns, not total returns (dividends excluded), and rolling averages, not a single start/end calculation.
https://www.fidelity.com/learning-center/wealth-management-insights/stocks-at-all-time-highs
- Data as of: article dated October 27, 2025 in search results; data window explicitly stated
- Exact figure: "Since 1950, in the year following an all-time high, average total returns for the S&P 500 index were 12.7%, compared to 12.6% for other 12-month periods."
- Methodology, verbatim: "Stocks represented by S&P 500 index total returns from 1950–2024."
- Note: This one is total returns (dividends reinvested), which is why it doesn't line up directly with J.P. Morgan's price-return figures above.
